DudeManScott
New member
- Joined
- Mar 4, 2017
- Messages
- 61
- Reaction score
- 0
97 7.3 California Emissions
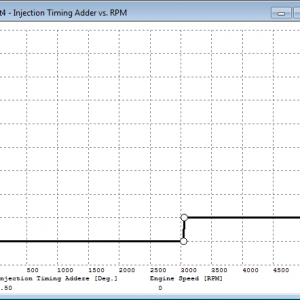
From what I have read I should be between
2450-2750 PSI and 35-40% under hard acceleration.
My PSI is on the low end but still in range, IPR seems good, just curious if this chart curve looks normal also. I can upload the forscan file if anyone wanted to look at it more.

Sent from my SM-G950U using Tapatalk
From what I have read I should be between
2450-2750 PSI and 35-40% under hard acceleration.
My PSI is on the low end but still in range, IPR seems good, just curious if this chart curve looks normal also. I can upload the forscan file if anyone wanted to look at it more.
Sent from my SM-G950U using Tapatalk